• Home
  • About Us
    • Our Mission and Vision
    • The Youth Workin’ It Team
      • Shae Pepper, Managing Director
      • Stephen Pepper, Operations Director
    • Recommendations for the Youth Workin’ It Team
  • Youth Work Resources
    • How To Plan A Youth Retreat Book
    • 52 Scavenger Hunt Ideas
  • Contact Us

Youth Workin' It

Consultancy and Resources for Youth Workers and Organizations Worldwide

  • Youth Group Games
  • Session Plans
  • Fundraisers
  • Youth Retreats
  • Life Skills
  • Interview Skills
  • Scavenger Hunts
  • Would You Rather Questions
  • Program Administration
  • Policies & Procedures
  • Youth Participation
  • Group Agreement

What Is A Logic Model?

July 12, 2013 By Shae Pepper Leave a Comment

What Is A Logic Model
That seems more logical than a² + b² = c²

There may be times when you’re asked by your line manager or donors to provide the reasons behind why you’re running the programs that you do. And honestly, even if you aren’t asked for them, it’s always a good idea to know why you do what you do.

Strategic planning can help that. One way you can do some strategic planning is through the creation of a basic logic model.

Over the next few weeks, we’ll create a basic logic model to help you explain why you’re running the youth work programs that you do. I’d like to make this as practical as possible, so please consider sending in your answers to the ‘homework’ listed at the bottom of the post.

What Is A Logic Model?

A logic model is basically a diagram or framework that shows the steps you’ve gone through to identify the needs and solutions to the issues facing your young people and/or community. It also explores what resources you have available and how ready stakeholders are to address problem areas.

The example of a logic model that I’ll be working from is used in a prevention setting by SAMHSA to identify problems, risk and protective factors and possible interventions so that the problems can be addressed.

Here’s an explanation as to what all these terms refer to:

Logic Model Glossary

Resources – What do you have available to help support your youth work? Think of resources beyond just money – consider the people, venues, transportation options and community supporters you have at your disposal.

Readiness – How ready to change are your community, organization and young people? If your needs assessment shows that there’s a problem with sexual health issues in your area but the school and health departments aren’t willing to admit that there’s a problem, your community is probably not at the readiness level to accept an intensive sexual education, contraception and sexual health program and clinic in your area.

Problems and Behaviors – This is where you identify the issues. Are your youth having drug issues or teen pregnancy and sexual health problems? Is there a lot of fighting or bullying in your youth programs or within the wider community between groups of youth? Has there been a spike in teen suicide or depression among the middle schoolers? Does your youth ministry lose students when they reach a certain age?

Problems and behaviors might be identified by you, but they can also (and often best) be identified through a needs assessment. This is a process of finding out what the needs are in the community through various research methods.

Risk Factors – This refers to all the reasons why a young person might be at risk for negative behaviors or problems. Parents that are absent, peer pressure, learning difficulties, relatives that use drugs and low self-esteem can all contribute to a young person being at risk.

Thinking back to the PCS model, risk factors can come from personal reasons, cultural, family and community reasons or reasons from within the wider societal context. Having one or more risk factors in a young person’s life doesn’t automatically mean they’ll have problem behaviors though.

Protective Factors – These are all the reasons why a youth may be protected from negative behaviors or problems. A great support network in the community, having a family with good income, having natural resilience and motivation to succeed and caring teachers make up a short list of possible protective factors. Having one or more protective factors doesn’t guarantee a youth without problem behaviors, but it is more likely.

Interventions – These are the things you do as a youth worker – your programs, mentoring, calls and texts, events and organizations. Interventions are the things you do to help youth achieve their best in the future and avoid problems and negative behaviors.

It could be something small like a drop-in session once a week to talk about safe sex or a weekly mentoring group. Maybe it’s posters you put up at the school or a drug-free dance you host at your church.

Check out the rest of this series on how to create a logic model:

  • Part 1 – This week
  • Part 2 – Identifying Problems & Behaviors
  • Part 3 – Risk & Protective Factors
  • Part 4 – Interventions & Programs
  • Part 5 – A Recap

Homework: Between now and next week (please submit answers by Thursday, July 18th at 12pm EST which is GMT -5 hours), think of a list of answers for each of the terms above that apply to your youth work. I don’t expect a full needs assessment to be completed, but you probably have some ideas as to what’s happening in your community and with your youth. Then, contact us through email, Facebook or Twitter (see below) and we’ll use your answers to create logic models in the coming weeks!

You can also connect with us by:

  1. Signing up to receive our posts via email
  2. Following us on Twitter
  3. Liking us on Facebook
  4. Signing up to our RSS feed


How Can I Stop Forgetting Important Tasks?

November 20, 2012 By Stephen Pepper Leave a Comment

Youth work reminders
Planning it old skool

Q: I keep finding myself forgetting to do important tasks and have missed the occasional meeting at work. What would you recommend for forgetful youth workers like me?!

A: Personally, I ‘d recommend using Google Calendar. It’s a great tool to keep track of your schedule, no matter where you are.

I find it to be far more useful and effective than using a paper-format weekly planner; here are 7 reasons why:

1. Unlimited Space

In a regular planner, you have a finite amount of space to enter tasks, meetings, etc. With Google Calendar, you can add as many entries as you need.

2. Time-based

You can add entries throughout each day and specify times for each task or meeting. This makes it far easier when scheduling everything you need to do, as you can see any available spaces in your schedule at a quick glance and ensure nothing overlaps.

3. Reminders

This is the feature that I find most useful. Google Calendar allows you to set up reminders by email or to pop-up for whenever you need them. These can be specified for x amount of minutes, hours, days or weeks before the event or task is due. If you have a smartphone, you’ll also get scheduled pop-ups on your phone if your Google account is connected.

You can set up as many reminders as you like, so for things like birthdays, I set a reminder for two weeks before and then another for two days before just in case.

4. Recurring Tasks & Meetings

With a regular weekly planner, you have to handwrite each entry, even if it’s the same entry each week. With Google Calendar, all you need to do is add an entry once and select “Repeat”. You can then specify when and for how often this task should be repeated.

For example, if your organization has a team meeting at 9:30 every Monday morning, just set this up once and select repeat. This will give you many options to tailor the recurrence, although in this particular scenario there shouldn’t be any change needed.

5. Intelligent Entry

If you add an entry that says “Meeting at work at 9:30am”, Google will automatically set the time of the meeting to 9:30am and the location as “Work” without you needing to adjust those fields.

(n.b. For further useful – but slightly creepy – intelligence by Google, try sending an email from your Gmail account that includes the phrase “I’ve attached”)

6. Invite Others

Google Calendar has an option to invite others to the meeting or task. If they have a Gmail account as well, this will automatically add it to their Calendar if they accept the meeting/task.

7. Accessible Anywhere

Google Calendar is available anywhere that you have an internet connection, meaning you don’t have to carry around a weekly planner. This makes it far easier to check your diary when you’re on the go and to add entries no matter where you are, particularly if you have a smartphone.

Question: What tools do you use as a youth worker to stop yourself from forgetting tasks or meetings? Let us know in the comments below.

You can also connect with us by:

  1. Signing up to receive our posts via email
  2. Following us on Twitter
  3. Liking us on Facebook
  4. Signing up to our RSS feed


How Much Should I Charge For A Youth Retreat?

October 23, 2012 By Stephen Pepper Leave a Comment

Youth retreat costQ: How much should I charge for a youth retreat? Quite a lot of the young people I work with are from low-income families, so I don’t want to set the price too high. I want to be sensitive to how much their parents can afford, but don’t know the best way to address the issue with them. Can you help?

A: Money is always a tricky subject, especially for activities that cost more like youth retreats. Like you said, it’s important to be sensitive to how much parents can afford without simultaneously embarrassing them that they may not be able to afford to send their child on the retreat.

Once you’ve started investigating possible youth retreat centers, you’ll have a much better idea of how much your budget will need to be. This is because the center will probably be the largest part of the budget. Check out our previous post for a more detailed guide on how to calculate a youth retreat budget.

Before making a final decision on which center to book, we’d recommend putting together a Parent Cost Feedback form.

What’s A Parent Cost Feedback Form?

The form should contain a table that lists the following:

  • A shortlist of three retreat centers
  • Some pros and cons of each center
  • The estimated cost for a child to go on the retreat
  • Empty boxes beneath each option

Try to estimate the total cost of the retreat and put this on the form, rather than just putting down the cost per child for the center only, as this will give the parents a better of idea of how much they can expect to pay overall. It doesn’t have to be a final quote at this stage, but enough to give parents a good idea of what the options are.

You could include more than three youth retreat centers on the list, but this might give too many options to get a true gauge as to how much parents can afford.

Beneath the details of each center on the form, the empty boxes are for parents to indicate which would be their preference. All they need to do is to put an ‘X’ in the box for the retreat center that they would prefer, taking into account the cost along with the pros and cons. Using only an ‘X’ helps ensure anonymity so that parents aren’t embarrassed to choose the cheapest option.

At the end, you should have a good idea as to which is the most affordable option for the parents.

How to get the form completed

How you get the form completed will depend on your contact with parents. Here are some different methods depending on parental contact:

Church

Many youth retreats are organized through churches, so if this applies to you then the best option will probably be to make an announcement during a service. Leave the Parent Cost Feedback form at the back of the church for them to complete as they leave.

Community Center

If parents drop their children off at your youth club at a community center, ask them to complete the form at that point. It’s best to get this done at the beginning of the evening rather than at the end, as parents will probably just want to get home when picking them up.

No Parental Contact

Perhaps you never get to communicate with the parents of your young people for whatever reason. If that’s the case, mail them a copy of the form along with a return envelope with a stamp on it to encourage them to reply.

Another option is to set up a survey through Survey Monkey. This is free and you can email the link to parents if you have their email addresses.

Downloadable Parent Cost Feedback Form Template

When you buy a copy of How To Plan A Youth Retreat, you also get exclusive access to many different youth retreat templates and forms. This includes a sample Parent Cost Feedback form, as well as a blank feedback form that you can complete with details of the retreat centers you find.

Discover more about the book using the link above or buy it from Amazon by clicking on the image to the right.

Question: How do you find out from parents how much they can afford for activities like youth retreats? Let us know in the comments below.

You can also connect with us by:

  1. Signing up to receive our posts via email
  2. Following us on Twitter
  3. Liking us on Facebook
  4. Signing up to our RSS feed


How To Use Charts and Graphs To Track Individual Youth Attendance

August 29, 2012 By Shae Pepper Leave a Comment

Youth attendance graphs and chartsOver the past few weeks we’ve been showing you the many ways in which you can use Excel – and subsequently the charts and graphs feature in Excel – to track youth attendance.  It’s valuable for many reasons, but two main ones are for proving outcomes in monthly and annual reports and to provide quantitative data for potential or current funders and donors.
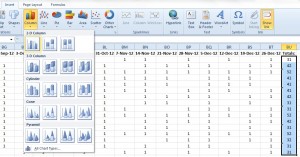
Our final charts and graphs today will show individual youth attendance. This is particularly useful if you have an ongoing program like a faith-based youth group or any other kind of youth club. You’ll be able to see what Johnny’s attendance was each year he was in your program, or if Jane’s attendance steadily increased or when Billy’s attendance dropped off after his parent’s divorce.

If your data will be used outside of your organization remember confidentiality and use codes to identify the youth in your program. In our example, we’ve just numbered the youth 1-16. However, if you’re using this purely for internal data you can also change the axis labels to show youth names.

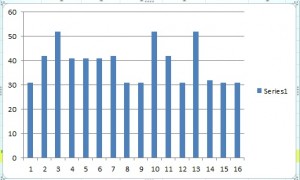
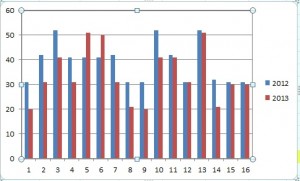
Firstly, a column chart to clearly show side by side the attendance of your youth from year to year.

1)  Open the youth attendance spreadsheet

2) Select or highlight the data from Column BU Row 2 to Column BU Row 17

3) Click the ‘insert’ tab at the top

Youth attendance - 1


4) Choose ‘column’ and click on the first 2D column chart

Youth attendance - 2

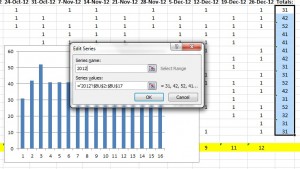
5) Right mouse click on the chart and choose ‘select data’ from the menu that appears

6) Under Legend Entries (Series) Select ‘Series 1′ and click ‘Edit’

7) In ‘Series Name’ type ’2012′ and click ‘ok’

Youth attendance - 3

8) In the box that appears now click ‘edit’ under the Horizontal (Category) Axis Labels

9) A data range box has appeared, select Column A Row 2 through Column A Row 17 and click ‘ok’, then click ‘ok’ again. (This is where you can choose to use student names if you want and you would instead choose Column B Row 2 through Column B Row 17)

Now you have the basics of your column chart (n.b. you may need to scroll along the spreadsheet to see the graph displayed).

Youth attendance - 4

To add 2013′s data to the same line graph, follow a similar process:

1) Right mouse click on the chart and choose ‘select data’ from the menu that appears

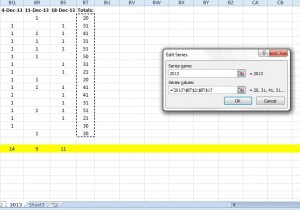
2) Under Legend Entries (Series) Select ’2012′ and click ‘Add’

3) In ‘Series Name’ type ’2013′. In the ‘Series Values’ box, delete the symbols there. Go to the bottom of your spreadsheet and click on the 2013 tab, select the data from Column BT Row 2 through Column BT Row 17 and click ‘ok’

4) In the box that appears now click ‘edit’ under the Horizontal (Category) Axis Labels

5) A data range box has appeared; click the 2013 tab and select Column A Row 2 through Column A Row 17 and click ‘ok’, then ’ok’ again.

Youth attendance - 5

Now you have a column chart that shows the attendance for each individual youth side by side for 2012 and 2013.

Youth attendance - 6

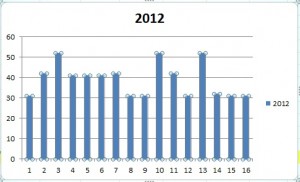
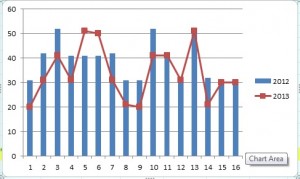
You can also easily view this same data as a line graph with markers

1) Right click on your column chart

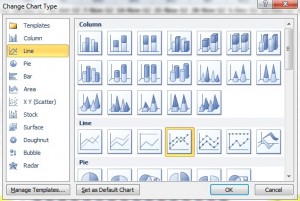
2) Select ‘Change Series Chart Type’

3) Select the fourth line graph shown ‘line graph with markers’ and click ‘ok’

Youth attendance - 7

This shows you the same data as the side by side comparison of the column chart, but it might also show the relationship between youth attendance in each year more clearly as well.

Youth attendance - 8

This concludes our series on how to use Excel, charts and graphs to track youth attendance.

Question: How useful has this series been for you? Please share your thoughts in the comments section below.

You can also connect with us by:

  1. Signing up to receive our posts via email
  2. Following us on Twitter
  3. Liking us on Facebook
  4. Signing up to our RSS feed


How To Create A Line Graph To Track Youth Attendance

August 22, 2012 By Shae Pepper Leave a Comment

Youth work line graphs
Because we know youth workers love line graphs this much

We’re currently working our way through a series that shows you how to use Excel to track your youth work attendance and how to use bar graphs, pie charts and line graphs to create visuals of that data. These charts and graphs can be very useful in monthly and annual reports and when showing data to prospective donors.

Today we’re going to share with you the steps to creating a line graph which will give a visual of the attendance data from both 2012 and 2013. You will be able to see the two years compared to one another and it will show trends in the data over the course of the year. In the detailed steps below, we’re using our example attendance spreadsheet. Remember the spreadsheet is simply an example – your data will not have such repetitive patterns in it.

1) Open the youth attendance spreadsheet

2) Select or highlight the data from Column U Row 19 to Column BT Row 19

3) Click the ‘insert’ tab at the top

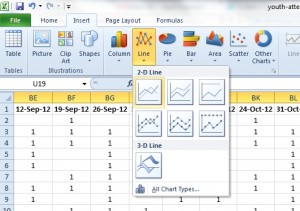
4) Choose ‘line’ and click on the first 2D line graph

Youth attendance 1

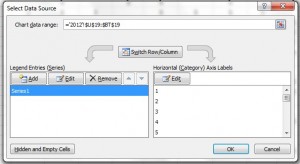
5) Right mouse click on the chart and choose ‘select data’ from the menu that appears

6) Under Legend Entries (Series) Select ‘Series 1’ and click ‘Edit’

Youth attendance 2

7) In ‘Series Name’ type ‘2012’ and click ‘ok’

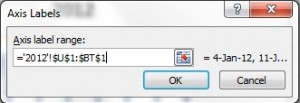
8) In the box that appears now click ‘edit’ under the Horizontal (Category) Axis Labels

9) A data range box has appeared, select Column U Row 1 through Column BT Row 1 and click ‘ok’, then click ‘ok’ again.

Youth attendance 3

Now you have the basics of your line graph (n.b. you may need to scroll along the spreadsheet to see the graph displayed).

To add 2013’s data to the same line graph, follow a similar process:

1) Right mouse click on the chart and choose ‘select data’ from the menu that appears

2) Under Legend Entries (Series) Select ‘2012’ and click ‘Add’

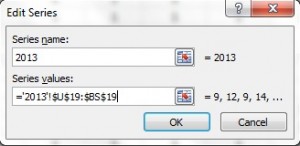
3) In ‘Series Name’ type ‘2013’. In the ‘Series Values’ box, delete the symbols there. Go to the bottom of your spreadsheet and click on the 2013 tab, select the data from Column U Row 19 through Column BS Row 19 and click ‘ok’

Youth attendance 4

4) In the box that appears now click ‘edit’ under the Horizontal (Category) Axis Labels

5) A data range box has appeared; click the 2013 tab and select Column U Row 1 through Column BS Row 1 and click ‘ok’, then ‘ok’ again.

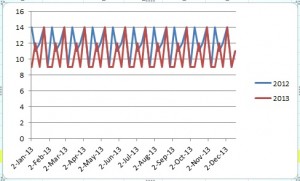
Now you have a line graph that shows the relationship between your attendance in 2012 and 2013.

Youth attendance 5

You might see a trend in youth attendance that peaks or drops at different times of the year. By tracking the data year after year and putting it in this visual format, you’ll be able to see more easily the attendance at your youth work programs.

Question: Are there any aspects of Excel you’d like to know more about to help with your youth work administration? Let us know in the comments below and we’ll try and cover this in the future.

You can also connect with us by:

  1. Signing up to receive our posts via email
  2. Following us on Twitter
  3. Liking us on Facebook
  4. Signing up to our RSS feed


« Previous Page
Next Page »

501 Would You Rather Questions

501 Would You Rather Questions

52 Scavenger Hunt Ideas

52 Scavenger Hunt Ideas cover

How To Plan A Youth Retreat

How To Plan A Youth Retreat cover

Categories

Best Of Youth Workin' It
Book Reviews
Guest Post
Spotlight on Youth
Types Of Youth Work
Would You Rather Questions
Youth & Society
Youth Group Activities
Youth Group Fundraiser
Youth Group Games
Youth Retreat
Youth Work Program Administration
Youth Work Q & A
Youth Work Session Plan Ideas
Youth Worker Stuff
Youth Workin' It Stuff

Tags

Administration Balloons Boundaries Budget Christmas Communication Facebook Food Food Games Global Issues Global Youth Work Goal Setting Group Development Group Games Guest Posts Interview Skills Life Skills Parents Planning Policies and Procedures Relationships Relay Games For Teenagers Scavenger Hunt Ideas School Self-Esteem SMART Social Media Strategic Planning Team Building Twitter Up Front Games Volunteering Volunteers Water Games For Youth Would You Rather Youth Behavior Youth Cartel Youth Group Bonding Youth Participation Youth Retreat Center Youth Retreat Themes Youth Scavenger Hunt Youth Work Definition Youth Work Resources Youth Work Training

Search Youth Workin’ It

All Content © Copyright 2011-2025, Stephen & Shae Pepper, youthworkinit.com